
Analytical Update
In order for the ramp to be both functional and safe, it was important to carry out the necessary calculations to ensure the designs reliability and feasibility. Materials were carefully chosen for each component of the design in order to fulfill all the requirements set forth and possess the strengths necessary to function safely. Design validation is currently being executed to ensure that the ramps integrity remains consistent throughout its operation lifecycle. This technical analysis includes Finite Element Analysis in Solidworks coupled with engineering theory and equations. The following analyses will be used to research the integrity of the accessibility ramp.
Finite Element Analysis
FEA was accomplished through the use of SOLIDWORKS which allowed for the modeled parts to undergo various series of applied forces. These forces were applied to very specific points of each component, and oftentimes the results were more accurate than what can be measured with the devices available to students. This method of analysis allowed for a visual and quantitative interpretation of the complex stresses each component will see throughout its life of operation. FEA deflection can be analyzed for each part to easily see the effects of loading. Below is the extent of FEA analysis the team has so far accomplished.
Upper Ramp Surface
The upper ramp surface was constrained and loads were applied in points where they would be if a wheelchair was ascending the ramp as seen in figure 1. There are four points of contact between the wheelchair and the ramps surface (one for each wheel). Each contact point exhibits a force of 187.5lb (750lb/4 points of contact).These contacts were distributed so that they were as far away as possible from the edge supports. The purpose of this was to determine the maximum stress when the user is on the weakest position, which is where the material is the thinnest. The resulting study can be seen in figures 2,3 and 4, which show the deflection, stress, and factor of safety, respectively.
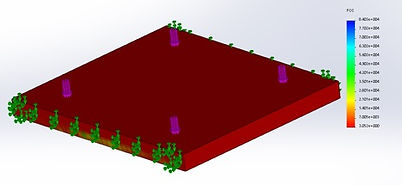


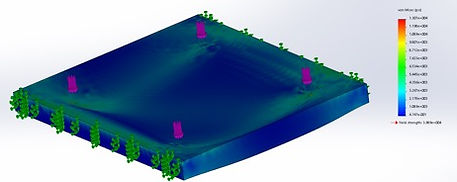
Figure 1: Ramp Surface Constraints
Figure 2: Ramp Surface Deflection Analysis
Figure 3: Ramp Surface Stress Analysis
Figure 4: Ramp Surface Factor of Safety
Upper Ramp Surface Results
Maximum Deflection: 0.1934 inches
Maximum Stress: 1.307*104 psi
Lowest Factor of Safety: 3.1
The results demonstrate that there will be a minimum factor of safety of 3.1, a max stress of 1.307*104 psi, and max displacement of 0.1934 inches. Of these values the factor of safety is the most important because it relates the max stress to the yield stress. A factor of safety of 3.1 is important because it shows that the ramp surface could hold 3.1 times the customers specified maximum. This means that even when the product is misused, there is very little chance that someone will break through the ramp surface. This also meets the validation standard defined by the project team which is a factor of safety of 3. The displacement was also very low (less than the defined 0.25in deflection needed) which means that the user will not sink into the surface while ascending the ramp.
Lower Ramp Surface
Loads and constraints were applied to the lower ramp surface in the same fashion as the upper ramps surface so they will not be explained here.
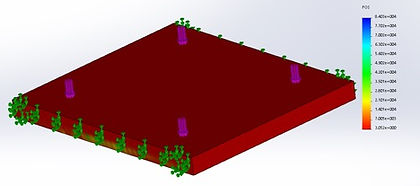
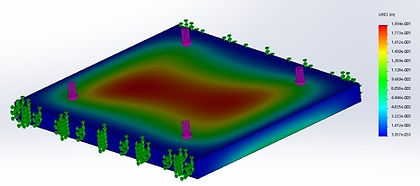
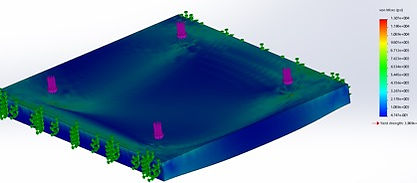

Figure 5: Ramp Surface Constraints
Figure 6: Ramp Surface Deflection Analysis
Figure 8: Ramp Surface Factor of Safety
Figure 7: Ramp Surface Stress Analysis
Lower Ramp Surface Results
Maximum Deflection: 0.1864 inches
Maximum Stress: 8.126*1043 psi
Lowest Factor of Safety: 4.9
The lower ramp surface has a minimum factor of 4.9, a max stress of 8.126*103 psi, and a max displacement of 0.1864 inches. The factor of safety for this part was slightly higher than the upper ramp surface since its geometry is slightly different (not as long). The factor of safety of this part shows that it can withstand 4.9 times the maximum load required by the customer. This is important because the part will be safe even under adverse loading conditions. As with the upper ramp surface, the displacement is low enough to not effect the user as they are traveling up the ramp.
Upper Leg
The upper leg was subjected to three different loading scenarios. The first loading scenario was with the upper holes (the ones that connect the upper leg to the ramp surface) constrained and a force was applied to the lower holes (the ones that connect the upper legs to the lower legs). This scenario will be referred to from this point on as bottom up loading. The second scenario was the exact opposite of the bottom up loading where the lower holes were constrained and the force was applied to the top holes. This will be referred to as top down loading. The last scenario was to test buckling where bottom up loading was used. The force used on each leg was the maximum loading of 750 lbf. The material chosen was 6061 - T6 aluminum. The results are shown below.
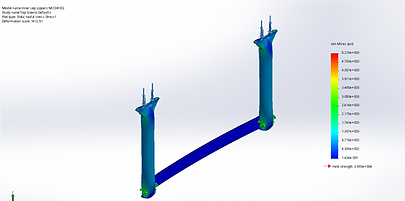
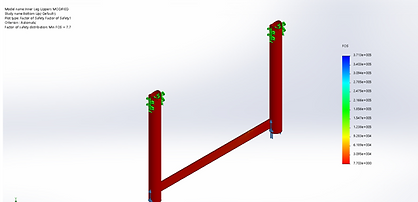
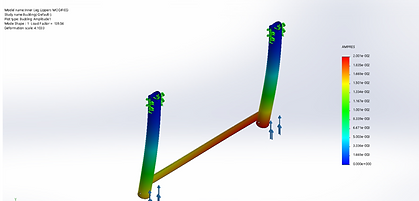
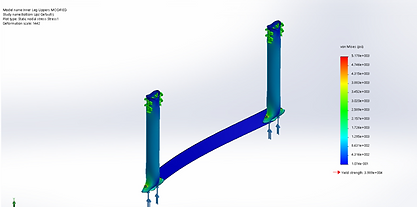
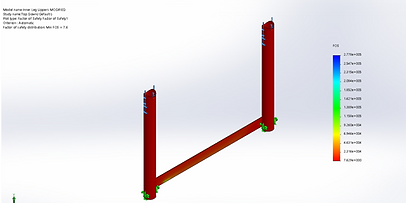
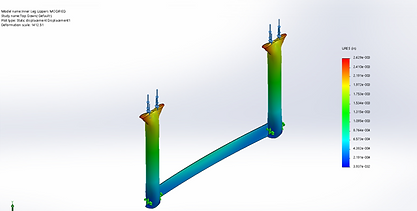
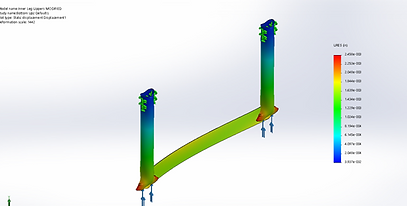
Figure 9: Upper Leg Up Loading Stress
Figure 10: Upper Leg Up Loading Displacement
Figure 11: Upper Leg Up Loading Factor of Safety
Figure 12: Upper Leg Down Loading Stress
Figure 13: Upper Leg Down Loading Displacement
Figure 14: Upper Leg Down Loading Factor of Safety
Figure 15: Upper Leg Buckling
Upper Leg Results
Maximum Deflection: 0.0026 inches
Maximum Stress: 5228 psi
Lowest Factor of Safety: 7.6
It is clear from Top down and Bottom up loading scenarios they have very similar results. The top down loading has a slightly lower factor of safety and higher stresses than the bottom up. Therefore only the top down loading results will be considered. The maximum stress under this loading condition is 5228 psi. The maximum displacement is 0.0026 inches. The minimum factor of safety is over 7.6 so the design is safe for these loading conditions. The Buckling factor of safety was given in SolidWorks to be 139.56 which is to be expected given that the bulk of the force is directed directly downwards. This factor of safety is much greater than the required value of 3 so it is safe for the application.
Lower Leg
The lower leg was subjected to the same loading as the upper leg.
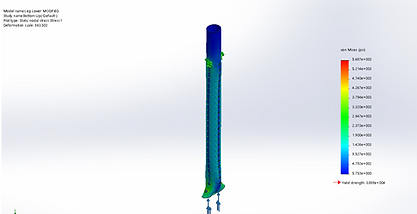

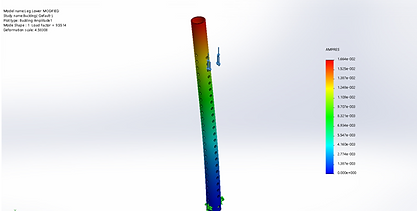
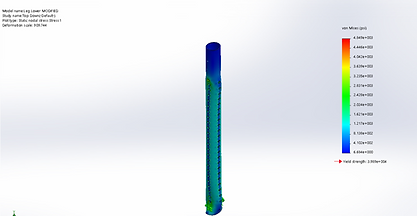
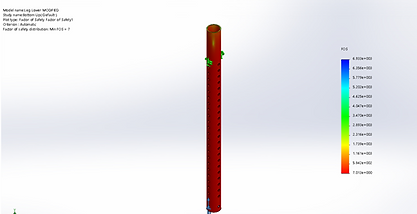
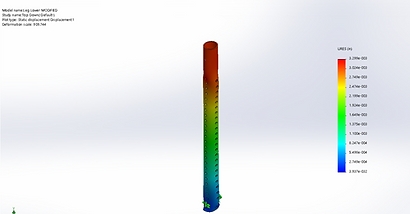
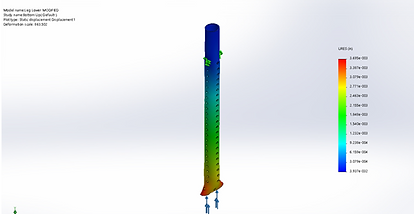
Figure 16: Lower Leg Up Loading Stress
Figure 17: Lower Leg Up Loading Displacement
Figure 18: Lower Leg Up Loading Factor of Safety
Figure 19: Lower Leg Down Loading Stress
Figure 20: Lower Leg Down Loading Displacement
Figure 21: Lower Leg Down Loading Factor of Safety
Figure 22: Lower Leg Buckling
Lower Leg Results
Maximum Deflection: 0.0036 inches
Maximum Stress: 5687 psi
Lowest Factor of Safety: 7.0
It is clear from Top down and Bottom up loading scenarios they have very similar results. The Bottom up loading has a slightly lower factor of safety and higher stresses than the bottom up. Therefore only the top down loading results will be considered. The maximum stress under this loading condition is 5687 psi. The maximum displacement is 0.0036 inches. The minimum factor of safety is over 7.0 so the design is safe for these loading conditions. The Buckling factor of safety was given in solidworks to be 9.55. This is lower than that for the upper legs because the material is thinner but it still more than meets the requirement of 3.
Foot Joint
The foot joint was loaded and constrained in two different ways. The first assumed that the fixed point was the lower hole where there would be a pin and was used to analyze the forces on the upper holes. The forces on the upper holes are bearing forces caused by a locking pin that connects the joint to the lower legs. The force was defined to be 750lbs distributed over the bearing area. This is the max load defined by the customer if it was concentrated directly over a single leg. This is much more force than the component would ever realistically see but it gives a good estimate of safety under adverse loading conditions.
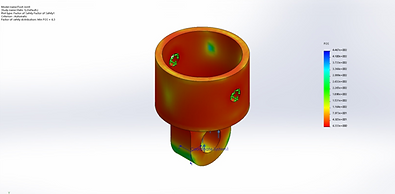
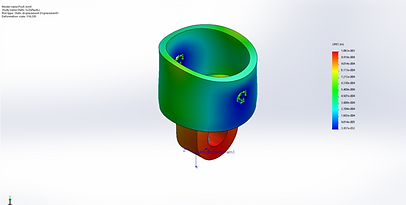


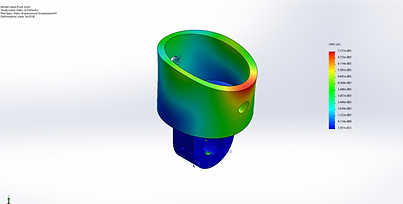
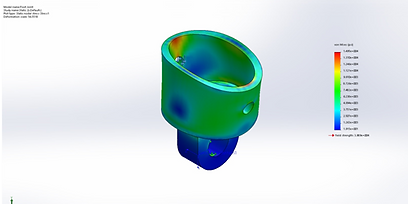
Figure 23: Foot Joint Upper Loading Stress
Figure 24: Foot Joint Upper Loading Displacement
Figure 25: Foot Joint Upper Loading Factor of Safety
Figure 26: Foot Joint Lower Loading Stress
Figure 27: Foot Joint Lower Loading Displacement
Figure 28: Foot Joint Lower Loading Factor of Safety
Foot Joint Results
Maximum Deflection: 0.007337 inches
Maximum Stress: 1.495*104 psi
Lowest Factor of Safety: 2.7
The first loading scenario had a minimum factor of safety of 2.7, a max stress of 1.495*104 psi, and a max displacement of 0.007337 inches. The second loading scenario had a max factor of safety of 6.3, a max stress of 6.298*103 psi, and a max displacement of 0.001082 inches. Of the two, the lowest factor of safety was 2.7 which is acceptable considering the actual load on the part would be about 1/6th (load distributed over the 6 legs) of what was tested. This means that the part will be safe even under adverse loading conditions. In addition, the deformation is almost negligible (less than the part tolerance) so it will not be a major factor in the safety or functionality of the device.
Foot
The feet provide the contact points between the rest of the components and the ground. As such, the ground was chosen as a fixed surface since the feet will be affixed to it with tie downs during real world use. The pin connecting the food joint to the foot will cause a bearing force on the holes from the weight of the user. For this analysis a load of 750 lbs was distributed between the two cylindrical connections. The 750 lb load simulates a user if all their weight was focused over a single leg. In reality this would likely never happen but it provides a better margin of safety. In reality, the weight would be distributed over the 6 legs (750 lbs/6 legs) but the full load over a single leg provides a better estimate for safety during misuse or adverse loading conditions.
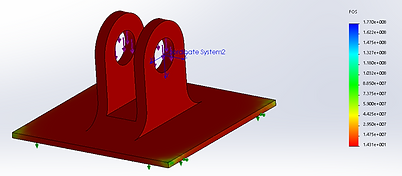
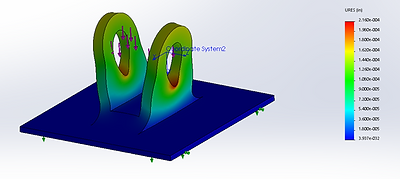

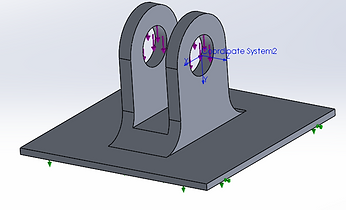
Figure 29: Foot Loading
Figure 30: Foot Stress
Figure 31: Foot Deflection
Figure 32: Foot Factor of Safety
Foot Results
Maximum Deflection: 0.000216 inches
Maximum Stress: 2.788*103 psi
Lowest Factor of Safety: 14
The max stress was 2.788*103 psi, the max displacement was 0.000216 inches, and the minimum factor of safety was 14. Even with the elevated loading conditions, the part has a very high factor of safety. It is so high, in fact, that some material could likely be removed to cut down on cost while still achieving the desired level of safety. Based on the FEA analysis this part has very little chance of failing in its current state. Deformation is also very little which means that there is very little chance of the pins falling out or moving during regular use.
Relevance of Results
The results gathered from the Finite Element Analysis (FEA) and hand calculations describe an initial validation of the design based on the requirements given. The Factor of Safety, Max Stress, and Deformation that are a result of the FEA and hand calculations of each part are all within the acceptable region for common practice. The values for loading and material properties were all taken directly from the design requirements given to the group by WNYIL. The Americans With Disability Act (ADA) was also referenced for the design criteria. Since all of the parts tested with FEA and hand calculations have a factor of safety which is acceptable, the results prove relevant to achieving the criteria with the designed parts.
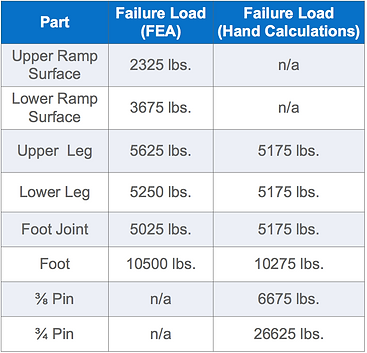
Hand Calculations
Along with FEA, the team also spent time doing analysis by hand. This was accomplished in order to compare with the results of FEA along with the failure test of the leg prototype. Using a customer define maximum load of 750 pounds, the failure loads were calculated. A results comparison of the hand calculations and FEA can be found in the chart to the right. It can be seen that in each case the results are within reason to each other. All of the equations used in the analysis can be viewed and interpretted in the Important Hand Calculation Equations section directly below.
Important Hand Calculation Equations
Bearing Stress
In the ramp bearing stress will occur at every pin joint which includes the ramp surfaces, legs, leg joints, and feet. Bearing stress could result the failure of the aluminum tubing used for the legs. This could lead to part failure so the bearing stress must be less than the yield strength of the material. The equation for bearing stress is shown in the below equation.
σb=P/Ab
Where P is the pressure acting on the bearing from the operator and Ab is the bearing area where the pins are located.
Bending Stress
Bending stress will occur in both the ramp legs and the platform.The equation for bending stress is shown in the below equation.
σbend=Mc/I
Where, M is the inertial bending moment about the neutral axis, c is the perpendicular distance from the neutral axis to the farthest point of the cross section, and I is the moment of inertia about the section.
Shear Stress
Shear stress is important primarily in the pins used to lock the legs into a certain configuration. The equation for shear stress is shown in the below equation.
τmax=3V/2A
Where, V is the total shear force and A is the cross sectional area perpendicular to the applied force.
Factor of Safety
The factor of safety is a quantitative measure of the load carrying capacity of a system in regards to an actual load applied on that system. Since the WNYIL living application is used to transport people and safety is an important customer requirement, the project team has made sure all parts have a factor of safety of at least 3. This ensured that even if the product is misused, it is likely not to fail. The factor of safety can be calculated using the below equations.
Max normal stress:
σ1,σ2=(σx+σy^2)±sqrt{[(σx-σy)/2]^2+τxy^2}
Max shear stress:
τ12=(σ1-σ2)/2
τ23=(σ2-σ3)/2
τ13=(σ1-σ3)/2
τmax=max(τ12,τ23,τ13)
Factor of Safety:
η=Ssy/τmax
Where σ denotes an axial stress, τ denotes a shear stress, η is the factor of safety, and Ssy is the yield strength of the material.